In the modern world businesses are awash with data—from material safety data sheets (MSDS) and pricing comparisons to customer reviews. It can be challenging to make decisions when you are literally overwhelmed with data.
How do you turn data into real information that you can act on? With indoor air quality (IAQ) arguably the best indicator for cleaning and maintenance in a facility—and the subsequent improved health of staff, visitors, and anyone else using the space—we need to make sense of data to ensure it informs more effective cleaning protocols.
Examining data sources
Let’s first do a quick review of where data comes from in the cleaning and maintenance world.
We’ve long had sensors that can warn us about core safety issues such as carbon monoxide in the air or fire and smoke in a building. Today, commercial-grade indoor air quality sensors also allow us to know:
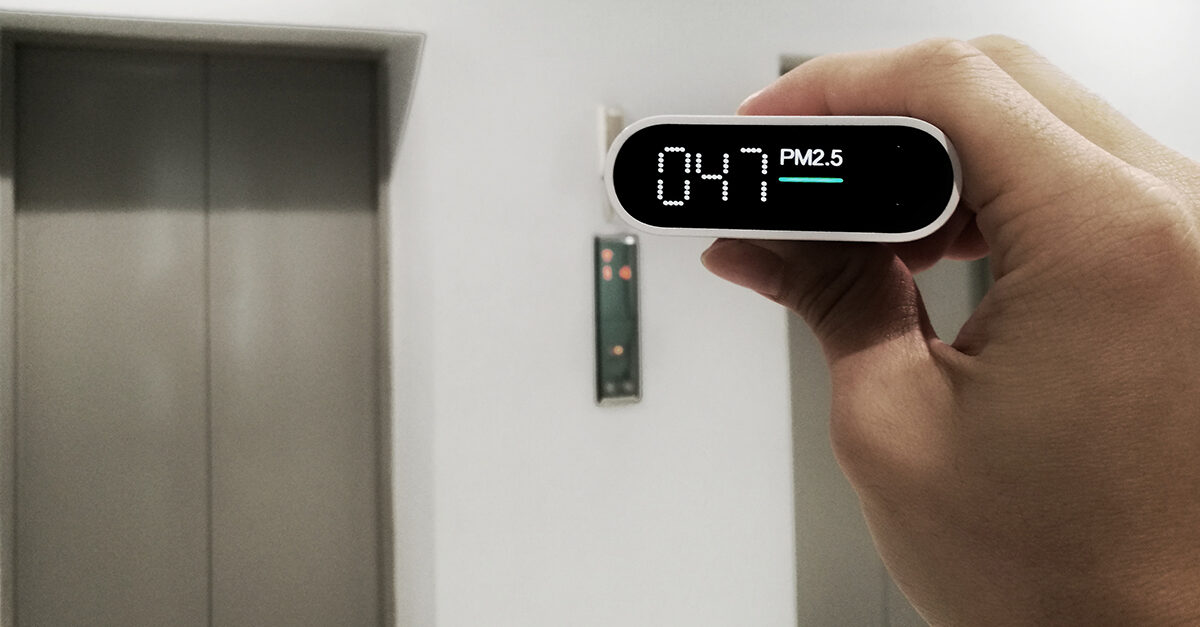
- How much dust (atmospheric particulate matter with a diameter of less than 2.5 micrometers or PM2.5) is in the air
- How many chemicals (volatile organic compounds or VOCs) are in the air
- What part of an HVAC system needs maintenance because it’s not moving carbon dioxide (CO2)
- What part of a building people are spending the most time in or which pieces of equipment require replacement or maintenance according to noise data.
For example, turning the data about dust into information allows us to know where to focus cleaning time. Imagine a world where a sensor lets you know that you need to spend more time cleaning surfaces in one area because of PM2.5 readings. The ability to have and then act on this knowledge has become feasible as more facility managers are adding PM2.5 sensors to their workplaces. These devices not only measure particles from local sources, but also particles from far away, such as air pollution caused by forest fires in the Pacific Northwest in 2020 that drifted all the way to New York.
Pollution isn’t the only source of IAQ problems. Various cleaning products, including hand sanitizer, will trip a VOC sensor. As many people are sensitive to chemicals, using data to pinpoint the facility areas where staff should use low-odor products will lead to fewer air quality complaints.
Data can also be a helpful way to show whether cleaning products are the true culprit for VOCs.
In some facilities, when building temperature rises, carpets and other surfaces begin to emit VOCs. Having data showing the exact time cleaning occurred as well as the time when air quality became a problem will help pinpoint the cause of IAQ issues.
Sending workers straight to the problem
Prioritizing maintenance can be difficult. In a large, complex building with fans, controls, and multiple surface types, setting a time for routine maintenance can be anything but routine. Indoor air quality data can tell us where to prioritize time. Everything from filter changes (PM2.5 data again) to pinpointing a stuck HVAC damper (seen with high CO2), can lead a team straight to a problem area rather have them hunting through a large building with vague clues.
Sounds (as measured in decibels or dB) can also be a great indicator for a broken vacuum (or one that can cause hearing damage) as well as a fan or motor in need of repair. It’s also a great way to identify high occupancy areas in a space (along with CO2 data) that are likely to require a deep clean. The office holiday party will certainly appear as a data-driven event!
Turning data into information allows cleaning and maintenance teams to be more efficient and effective. Nothing gives you more power to make improvements than data. But to use it effectively, you must meticulously record it. Once companies have collated this vital information, they will be well-placed to ensure the health and safety of employees, which in turn will increase staff loyalty and productivity.


