The Ohio State University (OSU) in Columbus, OH, is no small campus. It boasts approximately 600 buildings across 1,900 acres, and in 2015, had the third largest enrollment for public universities in the United States.
As the former director for environmental services for student life, Carl Bowman can tell you a lot about the university and its facilities. When he worked there, he was in charge of the cleaning and maintenance for any building associated with student life with the exception of classrooms and labs. This included all the dormitories, dining facilities, recreation facilities, and even the student union.
Bowman says while working at OSU, one of the biggest challenges was making sure that all of his employees (225 at his high point) across campus were completing tasks to the same standard. “I wanted to make sure that the standard we had in one area was pretty much the same standard we had in another,” he says. “Anything above and beyond would cost.”
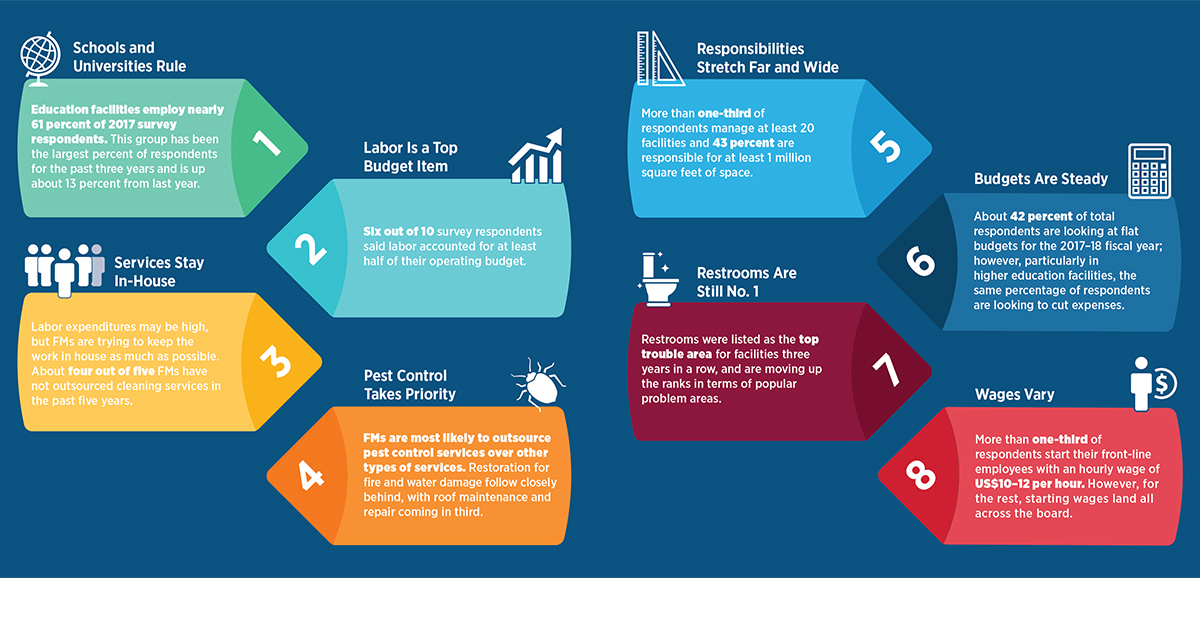
A good percentage of Cleaning & Maintenance Management (CMM) readers may be able to relate to Bowman’s challenge from his time at the university. About 33.5 percent of survey respondents from CMM’s 2017 In-House/Facility Management Benchmarking Survey work in education facilities at the college/university level, and about three-quarters of them are responsible for the cleaning/maintenance of 11 or more buildings. That’s a lot of square footage and a lot of responsibility. Let’s take a look at what else we learned from this year’s survey respondents.
Survey Summary and Methodology
This year, 272 respondents completed the In-House/Facility Management Benchmarking Survey, with about 60 percent of them working in some type of education facility (33.5 percent in higher education and 27.2 percent in K–12). The rest was split among hospitals (16.5 percent); commercial facilities, such as offices and government buildings (9.6 percent); long-term health care facilities (4.8 percent); hospitality facilities (4.0 percent); recreation/transportation facilities (2.6 percent); retail facilities (1.5 percent); and industrial facilities (less than .5 percent).
To conduct the 2017 In-House/Facility Management Benchmarking Survey, CMM editorial staff distributed the survey in April via email to all active contacts in the CMM in-house/facility manager email database. Survey questions were designed to address participants’ operations, employee, and purchasing dimensions, along with additional critical issues in-house/facility managers face on a daily basis. A roundup of responses and top findings are available in the download provided below.


